The Great Data Debate
Should you stick with Excel or move to Power BI? You’ve probably thought about it. But the answer isnt as easy as yes or no, it’s about understanding the specific job each tool was built to do.
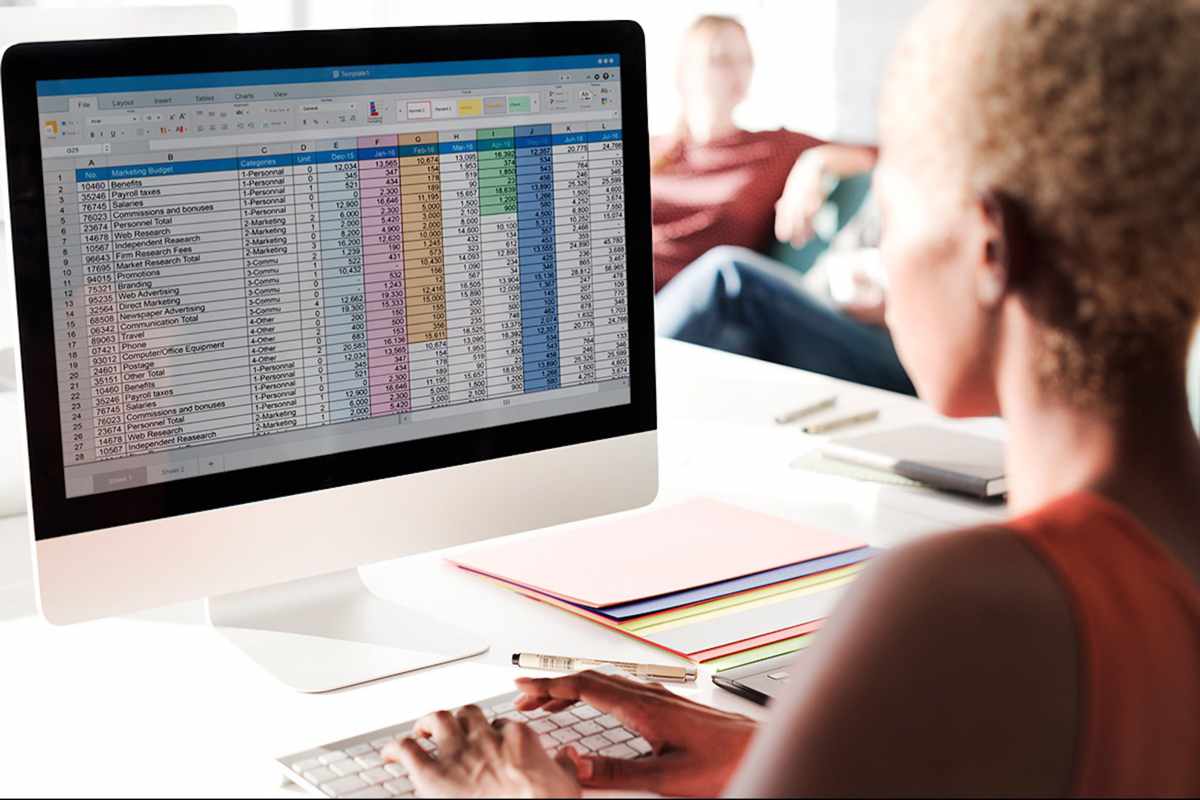
Sometimes you’re not even frustrated with the software itself, but a lack of specialised Microsoft Excel Training that leaves teams using these advanced tools in basic ways.
In WA we deal with massive datasets in logistics and mining so using the wrong tool can feel like trying to build a skyscraper with a hammer.
When Excel is Superior
Excel is the gold standard for what-if modelling and financial calculations.
Its flexible so if you need to quickly manipulate numbers for a project or a specific budget forecast, the grid layout of Excel is unbeatable.
Its also very familar, almost everyone in a Perth office has a baseline level of Excel skill, making it easy to share files for quick edits.
For mathematical modelling, Excel’s functions are still superior for cell level control.
When to Pivot to Power BI
Power BI is a Business Intelligence (BI) tool, not a spreadsheet. Its made for businesses that need a tool for things beyond manual reporting.
While Excel starts to lag after 100,000 rows, Power BI can handle millions of rows from multiple sources (SQL, SharePoint, Excel, Web).
Power BI also reports refresh automatically. You don’t run the report every Monday morning, you simply open the dashboard and see the live data.
For board meetings or executive summaries Power BI’s interactive dashboards allow leaders to find the why behind the numbers.
The Better Together Strategy
For most businesses the most all round choice is to use both for different tasks. Use excel for the heavy lifting of cleaning data and financial model. Then put that data into Power BI for distrubution and visualisation.
At Acuity we don’t just teach the tools, we help Perth businesses build the architecture that connects them.
Whether you need to build the skills of your team in the fundamentals of Excel or help your analysts master DAX in Power BI, the goal is always the same, turning raw data into a competitive advantage.